

Earnings Expectation Life Cycle
In our relentless pursuit of understanding market dynamics, we gather and dissect an extensive range of earnings and sentiment data. Our aim is to identify patterns and trends that influence stock prices, both in the immediate term and over the long run, even if some promising leads may not currently be in play. Our strategic journey of deciphering stock performance was launched with a sole focus on analyzing earnings and sentiment data. In the quest to unearth commonalities among stocks that either outperform or lag behind the market, we unwittingly stumbled upon an intriguing alignment with Richard Bernstein's Earnings Expectation Life Cycle.
Richard Bernstein is the CEO and Chief Investment Officer of Richard Bernstein Advisors LLC, a firm he founded in 2009. The firm provides investment advice and portfolio management to both institutional and individual clients, but before that he had long career at Merrill Lynch, of more than 20 years. His roles at Merrill Lynch included being the firm's Chief Investment Strategist and Head of the Investment Strategy Group. Bernstein is known for his expertise in earnings quality analysis and it was his 1995 book "Style Investing: Unique Insight into Equity Management" where he introduced the Earnings Expectation Life Cycle (though it was actually something he published years earlier at Merrill Lynch).
Richard Bernstein's Earnings Expectation Life Cycle is a theory that illustrates the cyclical nature of a company's earnings expectations and its impact on stock performance. The cycle comprises four distinct phases: Value Traps, Earnings Momentum, Positive Earnings Surprises, and Negative Earnings Surprises. 'Value Traps' refer to stocks that may appear cheap, but their earnings estimates are in decline. 'Earnings Momentum' describes stocks whose earnings estimates are trending upwards, often resulting in price appreciation. 'Positive Earnings Surprises' represent companies that report earnings exceeding market expectations, while 'Negative Earnings Surprises' involve companies whose earnings fall short of these expectations. This cycle aids in understanding and predicting the market sentiment and potential investment opportunities based on a company's position within the cycle.
Value Traps
A value trap is a stock that appears cheap or undervalued because it has a low price-to-earnings ratio (P/E), but really isn’t because the denominator in the equation – the earnings – are declining. Value traps are the bottom of the cycle and it tends to come when investors are the most pessimistic in the stock. The contrarian investor and the value investor will typically look to buy these stocks, but the trends can often last longer than expected and values traps lag the overall stock market.
We begin with Value Traps because they closely mirror Stan Weinstein's Stage I stocks. Indeed, there is a significant amount of commonality between these two theoretical approaches. Both theories segment a stock's lifecycle into four stages of momentum. However, Weinstein tends to concentrate more on the market's technical aspects, while Bernstein shifts his focus towards understanding the fundamentals and their influence on investor sentiment.
Stan Weinstein, a famous market technician, introduced the idea of four stages of a stock's lifecycle in his book "Secrets for Profiting in Bull and Bear Markets." Stage I, also known as the "basing" stage, is where a stock may appear stagnant, but is building a solid foundation for future growth. This stage shares similarities with the concept of Value Traps.
The critical lesson from these theories is that while Value Traps may seem like secure, bargain investments, their true nature can be deceptive. You might spot one just as it transitions into the next phase of its life cycle, poised for a potential upward move. However, the timing of this transition remains uncertain. As famously stated by economist John Maynard Keynes, "the market can stay irrational longer than you can stay solvent." Consequently, Value Traps often underperform the broader stock market for an extended period. Indeed, as the name implies, the allure of their low valuation can entrap you, locking you into a stock that underperforms.
Value Traps typically exhibit two main characteristics: The first is a low investor sentiment, which signifies a dwindling interest or confidence in the stock. The second characteristic is a downward trend in the company's earnings estimates, indicating weakening fundamentals.
In fact, despite their lower valuations, among the four stock groups, Value Traps performed the poorest from the beginning of 2002 until the end of 2022. By our definition, characterized by bearish investor sentiment and declining earnings estimates, Value Traps averaged a decline of 0.12% per quarter. This is calculated by purchasing at the opening price following the earnings announcement and selling at the closing price just prior to the next earnings release. Moreover, these stocks showed a decrease in value 59% of the time.
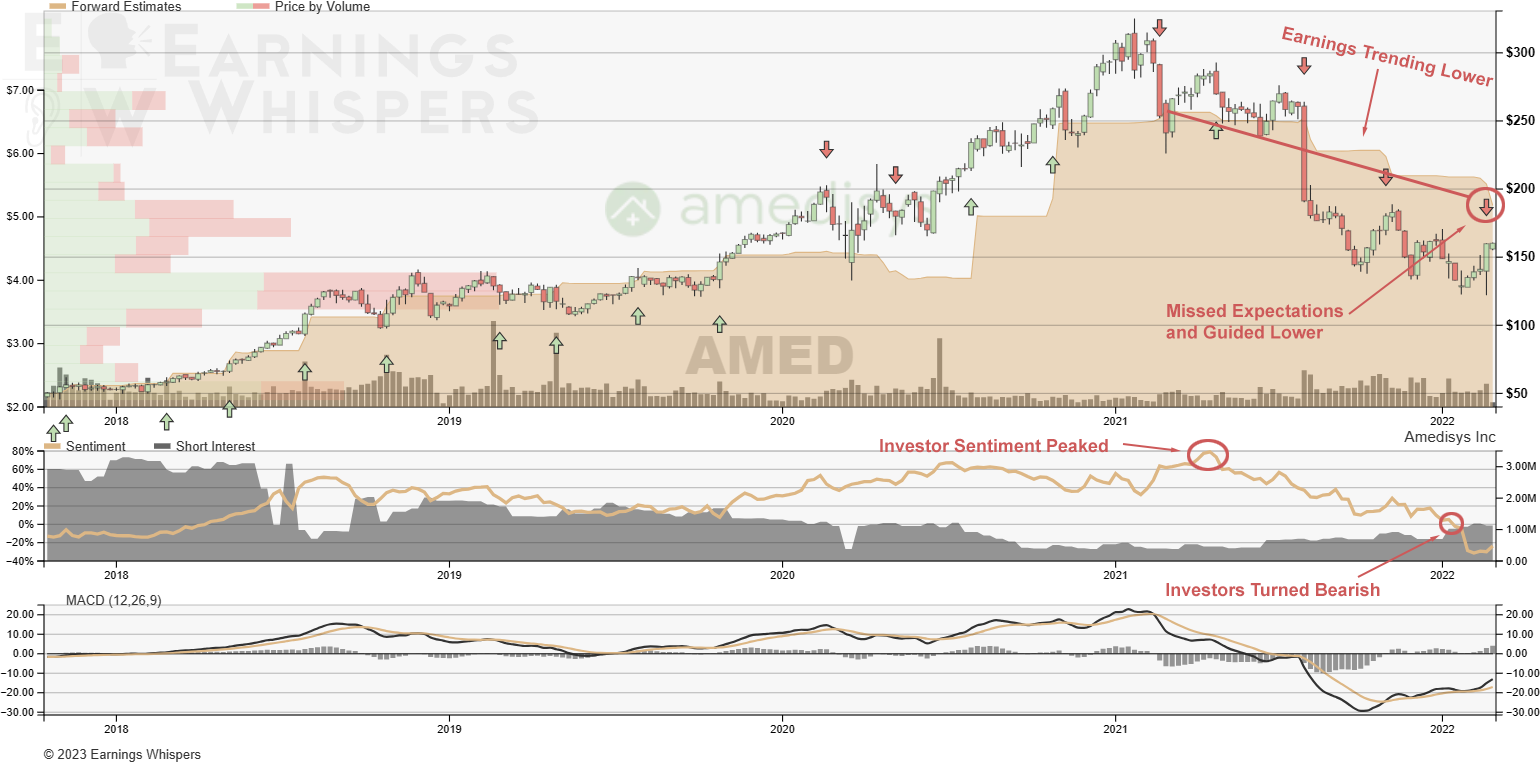
For instance, consider the case of Amedisys (AMED). It reached a significant cycle peak in early 2021, right before investor sentiment hit its peak. The estimates continued to trend downwards until the sentiment finally shifted to bearish at the start of 2022. On February 23, 2022, the company failed to meet expectations and reduced its future earnings projections. Consequently, the stock experienced a gap down on this news, followed by a robust short-term uptrend. However, those investors who bought during this rally ended up stuck with a stock that underperformed.
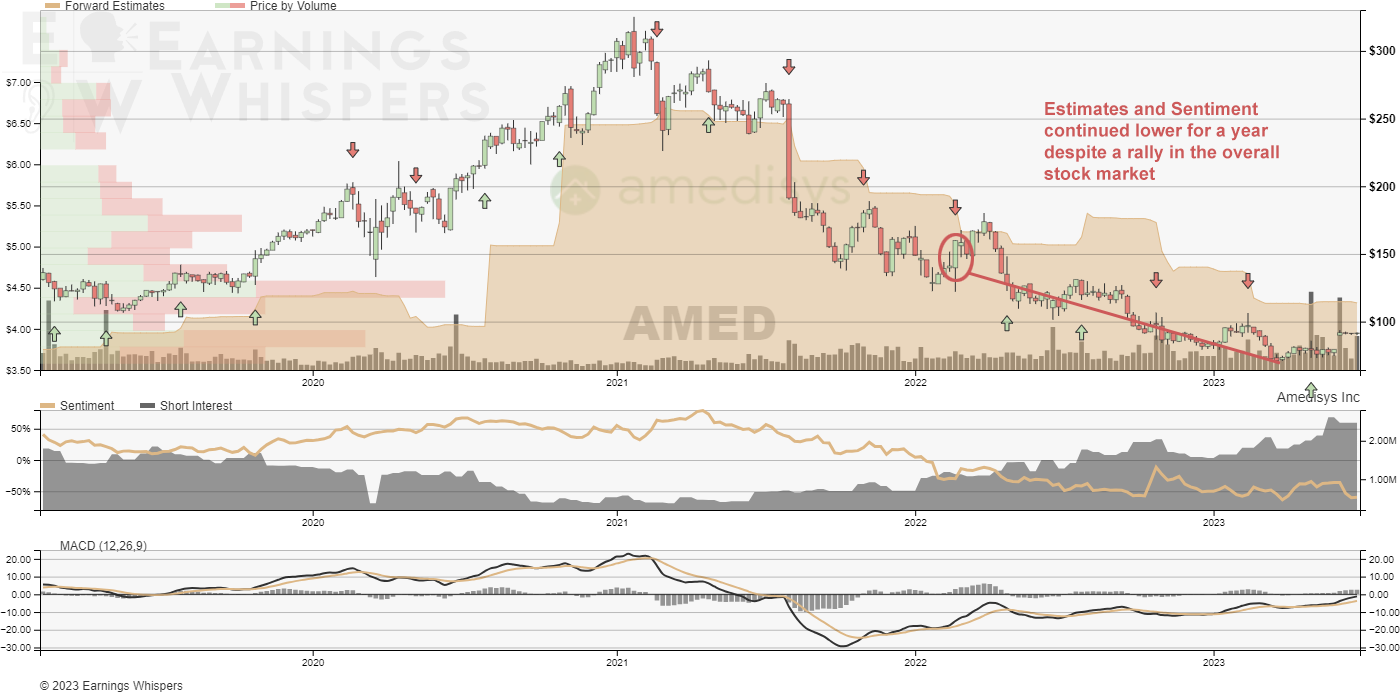
In the following year, even though the broader stock market managed to recover from its low point and staged a strong rally, Amedisys shares continued their descent. This downward trend was fueled by persistently lower earnings and decreasing investor sentiment. A little over a year later, the stock was trading approximately 45% lower than the point it had gapped down in February 2022.
Therefore, Value Traps represent what may initially seem to be low-priced, attractive investments, but the reality is often different and investors should approach such stocks with caution. While seeking value is a key part of investing, it's equally important to avoid these traps, as they can lead to significant underperformance and potential financial losses. It is much better to wait for a stock to move into the next phase of the Earnings Expectation Life Cycle
Positive Earnings Surprise Phase
- the foundations for Stage II Breakouts
The phenomenon known as the Post-earnings Announcement Drift (PEAD) was first introduced to us by Ray Ball and Philip Brown in 1968. However, it wasn't until over a decade later that EJ Elton, Martin Gruber, and Mustafa Gultekin shed light on its true nature. They suggested that PEAD is less about forecasting actual earnings and more concerned with shifts in investor expectations. The transition of stocks from Value Traps to the Positive Earnings Surprise Phase in the Earnings Expectation Life Cycle typically marks the point at which investor expectations begin to improve. Rather than being tied to a single event or earnings release, this transition is often a gradual process.
As articulated by Mr. Bernstein, "eventually a low-expectations company begins to disseminate more optimistic information [and] the stock regains investor attention." We define this transition as the Positive Earnings Surprise Phase, which is characterized by an uptick in earnings data despite the prevailing bearish investor sentiment, resulting in upward revisions to estimates. In comparison to stocks with bearish sentiment and downward-trending earnings that see a decline 59% of the time over a quarter, stocks with bearish sentiment coupled with upward-trending estimates witness a rise 56% of the time during the same period.
Larry Kudlow is often quoted saying, "earnings are the mother's milk of stock prices." However, as previously pointed out, it's the anticipation of future earnings, rather than the earnings themselves, that significantly influence stock prices. This shift in expectations usually happens when a company with low sentiment unexpectedly reports robust results. But it's important to note that there are numerous factors, not all of them company-specific, that can raise expectations for future earnings. The ultimate aim is to invest in stocks experiencing a rise in sentiment rather than just an increase in earnings. Generally, one doesn't persist without the other though.
Ideally, this phase correlates with what Weinstein described as Stage II, or the 'advance phase' of the stock's life cycle, where the primary trend is upwards. This stage signifies a move from a baseline, characterized by low investor sentiment, ideally accompanied by increased trading volume and a rise above its long-term moving average (Weinstein used a 180-day moving average). Crucially, during this stage, both fundamental and technical indicators should be on an upward trajectory.
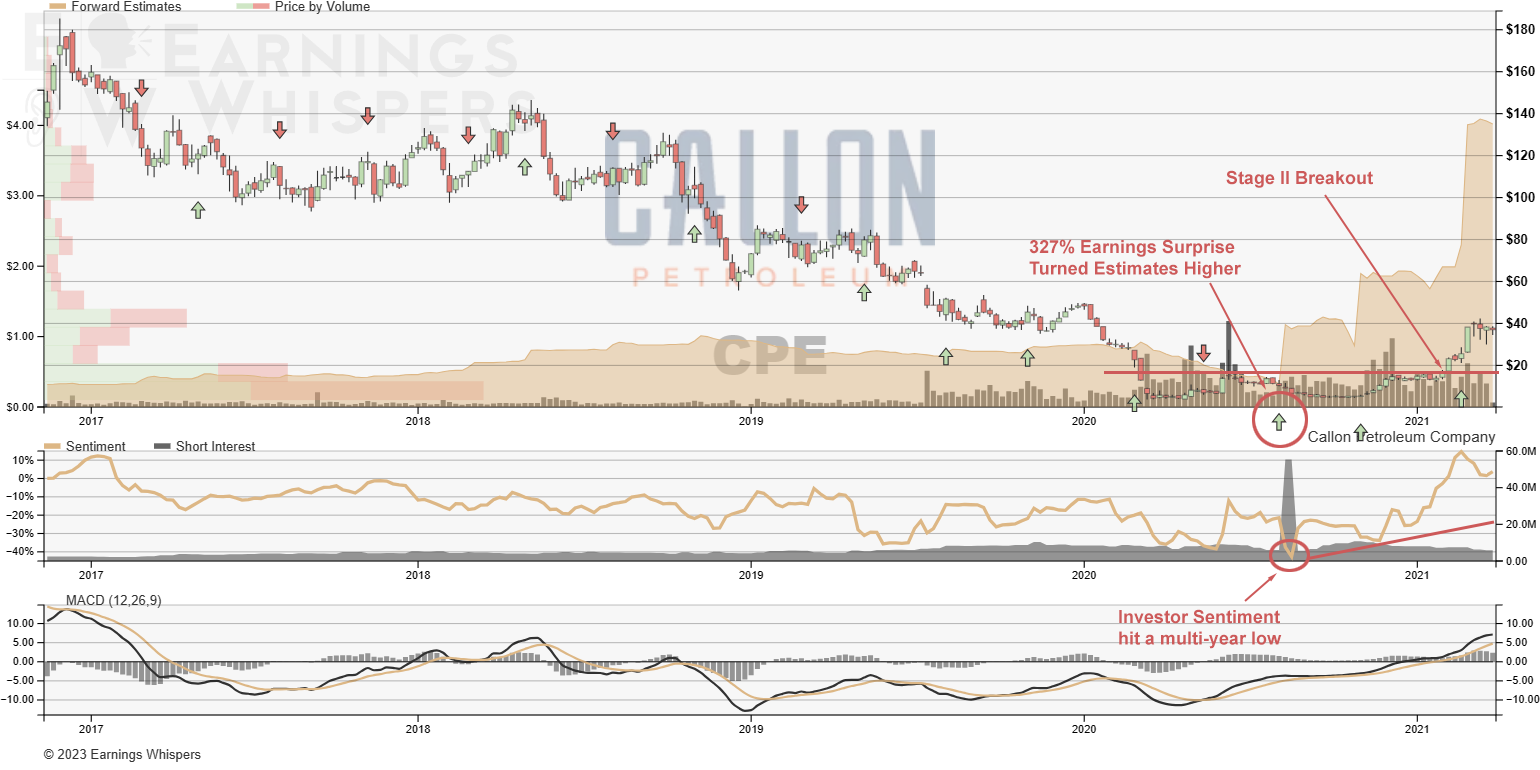
The late 2020 and early 2021 performance of many Energy stocks offers quintessential illustrations of this transition. One of our top picks at that time was Callon Petroleum (CPE), which saw vigorous accumulation under $15 alongside significant trading volume, while the stock price remained stagnant - a clear indicator of a Stage I situation. However, the scenario dramatically shifted when the company exceeded expectations by over 300% just as investor sentiment dropped to a new low. From that point, both earnings and sentiment began to rise, driving the stock from the Value Trap into the Positive Earnings Surprise Phase of the Life Cycle. Despite this, the stock continued its lateral movement until the very end of the year when it finally began breaking out from its base, clearly transitioning into a Stage II stock. Although not depicted in this chart, by mid-2021, Callon Petroleum had seen a 300% surge from its breakout point.
Thus, the Positive Earnings Surprise Phase of the Earnings Expectation Life Cycle is a critical inflection point for a stock, representing a shift from a low-expectation environment to one of improving investor sentiment and increasing earnings estimates. Successful navigation through this phase aligns with Stan Weinstein's Stage II of a stock's lifecycle, which can often signal robust future performance. It's essential for investors to grasp these dynamics to better identify opportunities for profitable investment and avoid potential Value Traps.
Earnings Momentum
- The Big Trend Higher
The wisdom of John Maynard Keynes, who once remarked that 'markets can remain irrational longer than you can remain solvent,' is particularly relevant in understanding the dynamics of the Earnings Momentum phase in the Earnings Expectation Life Cycle. This phase is critical in the life cycle of a stock, often marking the beginning of substantial upward trends.
The journey to the Earnings Momentum phase typically begins with a stock entering the Positive Earnings Surprise Phase. This occurs when a company, despite low investor sentiment and following a period of downward earnings revisions, reports unexpectedly positive results. This phase acts as a pivot, shifting the tide from pessimism to a gradual improvement in investor sentiment and upward revisions in earnings estimates. As this becomes more apparent, the stock transitions into a momentum stock, and price tends to follow these changing perceptions and forecasts.
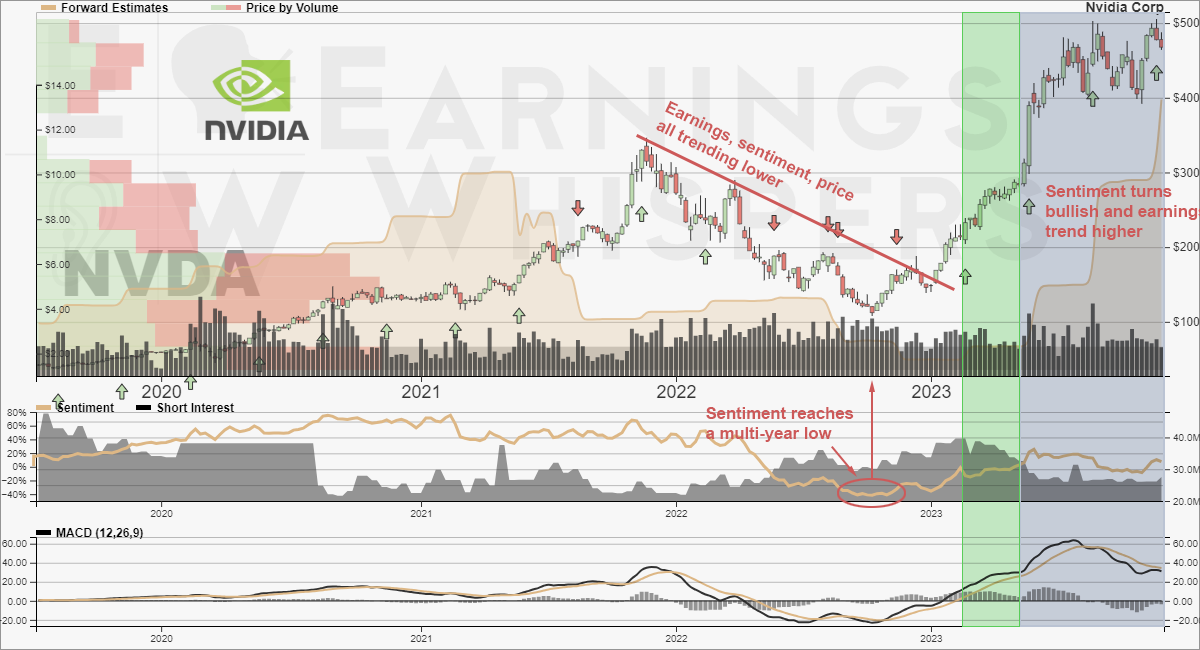
The Earnings Momentum phase is where we often see prolonged upward trends in stock prices and often the biggest moves. A quintessential example of this phase can be seen in the performance of certain tech stocks. For instance, in late 2021, a NVIDIA (NVDA) experienced a downturn with bullish investor sentiment and declining earnings estimates. However, in early 2023, the company reported an upside surprise while investor sentiment remained bearish, transitioning the stock into the Positive Earnings Surprise Phase. When the subsequent quarter's results rolled in, investors were becoming bullish the stock and the results rapidly drove earnings estimates higher. The stock firmly entered the Earnings Momentum phase, leading to a significant rally of more than 67% over the next several months.
The duration of the Earnings Momentum phase can vary widely, ranging from a few months to several years, and is a period typically characterized by the stock's outperformance. While it's impossible to precisely predict the length of this phase, trend followers find this period especially lucrative. It's also observed that purchasing stocks just before a company's earnings announcement in this phase can be particularly beneficial. Over the past 20 years, i fyou had bought the S&P 500 on any random day and held it for three months, you would have averaged a gain of 2.0%. However, if you had bought at the open following a company's earnings release when investor sentiment was buyllish and estimates were revised higher, you would have averaged a gain of 5.0% if held until just before the next earnings release.
Earnings Momentum stocks are more likely to go higher leading up to an earnings announcement too. Over the same period, buying any random stock four trading days before the earnings release when investor sentiment was bullish and estimates had been revised higher during the quarter saw a gain of 0.72% if held until the open following the earnings announcement, which is a 45% annualized return.
Negative Earnings Surprise Phase
- The Torpedo
- Stage IV
No one knows how long a stock will remain in Stage II, or in the Earnings Momentum phase of the life cycle. By the time investor sentiment peaks, the stock has likely transitioned into what Stan Weinstein referred to as the “Distribution Phase” or “Top Area”. Earnings estimates may still be trending higher, but have likely stalled or slowed. However, once the company misses estimates or provides negative guidance, it suddenly becomes clear to the market that those estimates are wrong and need to be revised lower. Often, this sudden realization translates into a swift selloff with heavy volume. Some investors will look to buy this selloff because, after all, investors are still generally bullish on the stock, but this is a bearish combination that is typically just the start of the new trend lower. This puts the stock into the Negative Earnings Surprise phase of the Earnings Expectation Life Cycle and at the start of Mr. Weinstein’s Stage IV – the Downward Stage. This is where it becomes most profitable to short stocks after earnings.
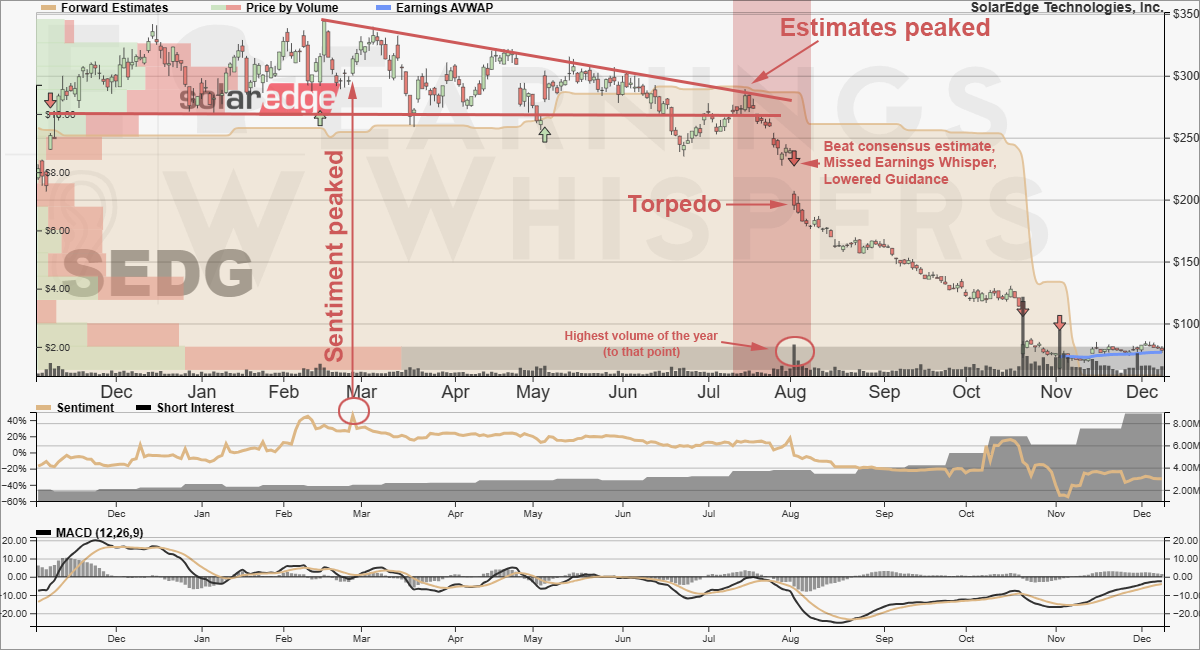
Take, for example, SolarEdge Technologies (SEDG), which had stalled above $250 in early 2023. Sentiment peaked in late February, just days after the stock peaked. Analysts continued revising their estimates higher all the way into early July, but then, just before the company reported earnings, analysts started revising estimates lower going into the announcement. With sentiment still bullish, the stock transitioned into the Negative Earnings Surprise Phase. This isn’t exactly textbook, because typically the earnings announcement initiates the start of downward estimate revisions, but with sentiment still bullish when the company reported earnings in August, the conditions were there for what Richard Bernstein called the “Torpedo”.
The company reported earnings of $2.51 per share, which was above the consensus estimate of $2.50 but well below the Earnings Whisper of $2.65 per share, and the company gave revenue guidance of $880.0 million to $920.0 million for the next quarter, which was below the consensus estimate of $1.04 billion. The stock closed lower by 18% on the day on its highest volume of the year, but this was only the start of the move. By the time the company reported earnings the next quarter, sentiment had turned bearish, turning the stock into a Value Trap, and the stock was down an additional 63%.
Integration of the Earnings Whisper Grade into the Earnings Expectation Life Cycle
The Earnings Expectation Life Cycle, as introduced by Richard Bernstein, is a comprehensive framework for analyzing the cyclical nature of a company's earnings expectations and their impact on stock performance. This cycle consists of four distinct phases: Value Traps, Earnings Momentum, Positive Earnings Surprises, and Negative Earnings Surprises. It overlaps with Stan Weinstein's stages, but utilizes fundamental data and investor sentiment to improve the identification of the phases.
Value Traps: These are stocks that seem undervalued due to a low price-to-earnings ratio, but are actually declining in earnings, often leading to underperformance in the stock market. This phase is marked by pessimism and declining investor sentiment. Stocks bottom in this phase, but it typically pays to short Value Traps ahead of earnings.
Positive Earnings Surprises: This phase occurs when companies report earnings exceeding market expectations, leading to an improvement in investor sentiment and further upward revisions in earnings estimates. It marks the transition from a Value Trap into the Earnings Momentum phase and can be subtle, but is often marked with an Earnings Spike that catipults the stock higher.
Earnings Momentum: In this phase, stocks exhibit upward-trending earnings estimates, often resulting in a rise in their stock price. Investors become bullish during this phase, and it typically pays to buy these stocks ahead of earnings, take advantage of the potentially long upward trend in the stock.
Negative Earnings Surprises: Occurs when a company fails to meet earnings estimates or issues negative guidance, while investors remain bullish, and often leading to a swift selloff, or a "Torpedo". Stocks in this phase transition into Weinstein's Stage IV – the Downward Stage, which can be an opportune time for short selling after the news with time for the stock to continue a drift lower.
Overall, the Earnings Expectation Life Cycle is a valuable tool for understanding and predicting market sentiment and investment opportunities based on a company's current phase in the cycle.
The Earnings Whisper Grade is a pivotal tool in understanding the Earnings Expectation Life Cycle. It hinges on the impact of earnings announcements, which are fundamental drivers of a stock's directional trend in earnings estimates and future expectations. While this grade doesn't foresee shifts in market sentiment or operational and economic changes throughout the quarter, it plays a key role in mapping a stock's trajectory within the life cycle based on its immediate earnings performance.
Read more about the Earnings Whisper Grade
- Influence on Forward Earnings Estimates: Typically, strong earnings results drive forward earnings estimates upward. This positions a stock in the left hemisphere of the life cycle, indicating a phase of positive momentum and upward revision in expectations.
- Positioning in the Life Cycle: Conversely, low or weak expectations often place a stock in the lower hemisphere of the life cycle. This suggests a phase where the stock is potentially undervalued or experiencing declining earnings, akin to Value Traps.
- Transition to Positive Earnings Surprise Phase: A crucial juncture occurs when a stock with initially low expectations delivers strong results, thus transitioning into the Positive Earnings Surprise Phase. This shift is a strong indicator of potential outperformance relative to the overall stock market.
- Earnings Whisper Grade Implications: A higher Earnings Whisper Grade is often awarded to stocks that successfully transition into the Positive Earnings Surprise Phase. This grade reflects not only the company's current earnings performance but also the likelihood of its future market outperformance.
In essence, the Earnings Whisper Grade serves as an insightful indicator within the Earnings Expectation Life Cycle, gauging a stock's position and potential trajectory based on its latest earnings results. This makes it an invaluable tool for investors looking to understand and predict stock performance in relation to market expectations.